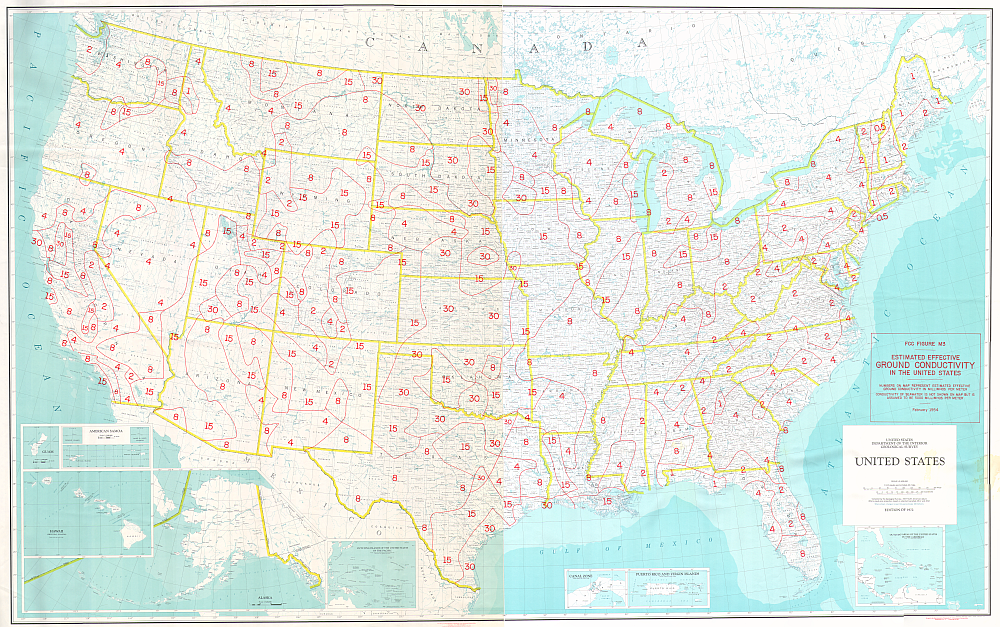
Figure R3 of 47 CFR 73.190 of the Commission’s Rules contains a map of the estimated effective ground conductivity in the United States. This data is used to predict the propagation of AM signals across the United States. A higher ground conductivity indicates better AM propagation characteristics. The map shows that the ground conductivity in the U.S. ranges between 0.5 and 30 millimhos (or millisiemens) per meter. The conductivity of seawater is 5,000 millimhos per meter, resulting in the best propagation of AM signals.

The color map here was printed for the FCC around 1975. Originally the map consisted of two large-print sections (East and West, each approximately 45 by 43 inches.). The sections were scanned in parts, and then the parts joined with photo-stitching software. There may be some artifacts and minor distortion from this process, but on the whole the map here should suffice for most purposes. The map can downloaded in three sizes: TIFF file, 151 MB, PNG image, 17.6 MB, or PNG image, 1.2 MB (pictured) .
The M3 conductivity data is also available as text files. Data for the continental USA is located in the file m3.seq, which also contains updated conductivity data for the Chesapeake Bay and Puget Sound that is not shown on the wall map. Data for Hawaii is contained in the file m3hw.seq. Data for the rest of Region 2 (the Western Hemisphere) is contained in the file r2.seq.
Lastly, the M3 map segments may also be displayed in Google Earth for the continental USA, Canada, and Mexico, via the following KML files: M3 as KML or M3 as text file.
Information about AM broadcast radio stations is available at the Audio Division on the FCC's website, and at Broadcast Radio Links.
FCC > Media Bureau > Audio Division, (202)-418-2700.